

What is an infographic
Infographics are visual representations of information, data, or knowledge. They have become very popular on the Internet as these charts allow us to grasp and understand difficult concepts quickly. Our brain is specially designed for visual analysis combining images with data. Visualizations help transmit knowledge more effectively than if we simply used text and numbers so that they can be very useful.

A few years ago, infographic creation was limited to academics, companies, and government institutions, who had access to large amounts of data and graphic designers. With the advent of free web applications and online data publishing, it is now possible for everyone to create beautiful infographics.
Below you will find some of the useful tools that can be used for this purpose.
![]()
Piktochart
Piktochart is a web application that allows you to create beautiful infographics from templates, images, and objects that are added with a simple drag and drop. It allows you to customize colors and fonts in just one click, being very easy for beginners to use. It is also possible to export the creation as an image to embed the infographic on a web page or blog. It offers eight templates in its free version and offers more than 600 in its payment option. Piktochart is certainly one of the most useful options found on the Internet.
DesignCap is one of my favorite design tools that I frequently use to create photos, infographics, banners, and posters that illustrate blog posts. It contains a large number of templates to inspire you and customize to your liking, being very easy to use. It also allows you to choose from a large number of charts, widgets, maps, modules that perfectly combined with text and icons. Once finished, you can export your work in pdf, png, or jpg format.
Easel.ly is a web tool that also allows you to create sophisticated infographics from the templates they offer. You can drag and drop within them all kinds of symbols (lines, shapes, text, own images, icons, etc.) to customize the result without losing clarity or quality. Infographics can be freely exported in jpg, pdf format, and web format to be shared online with the paid account.
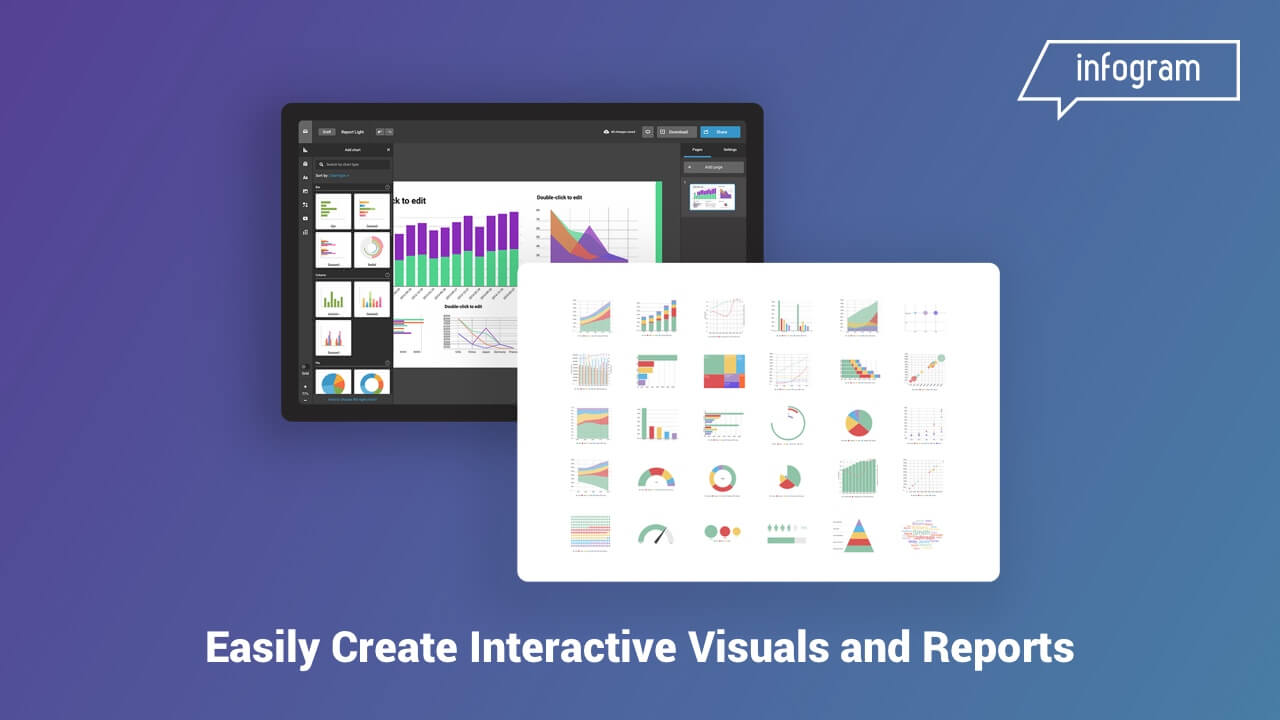
Infogram is an online tool that allows you to upload your own data with which you want to create interactive charts. The free account offers more than 37 types of graphics and 13 types of maps to add to an infographic. You can also create a custom infographic URL to view the graph and obtain the HTML code to add it to the blog or website. It also includes the possibility of making dynamic infographics with the graphics obtained through templates.
Hohli is a very intuitive and simple online tool that allows you to choose between a wide variety of graphics (Venn diagram, bar diagram, pie charts, radar, etc.). It allows you to enter your data, customize colors and sizes, and obtain a high-quality graphic to be inserted on any web page.
What other tools do you use to create stunning infographics and visual content? Leave us your recommendations in the comments.


